Evaluating cold outreach requires tracking the right performance indicators. Without industry-standard benchmarks, it is easy to misdiagnose problems—blaming your sales copy when the real culprit is domain deliverability, or celebrating high open rates that produce zero revenue conversations.
This guide outlines realistic B2B cold email benchmarks, breaks down the math behind high-converting campaigns, and provides diagnostic frameworks to optimize underperforming metrics.
1. The B2B Cold Email Benchmark Matrix
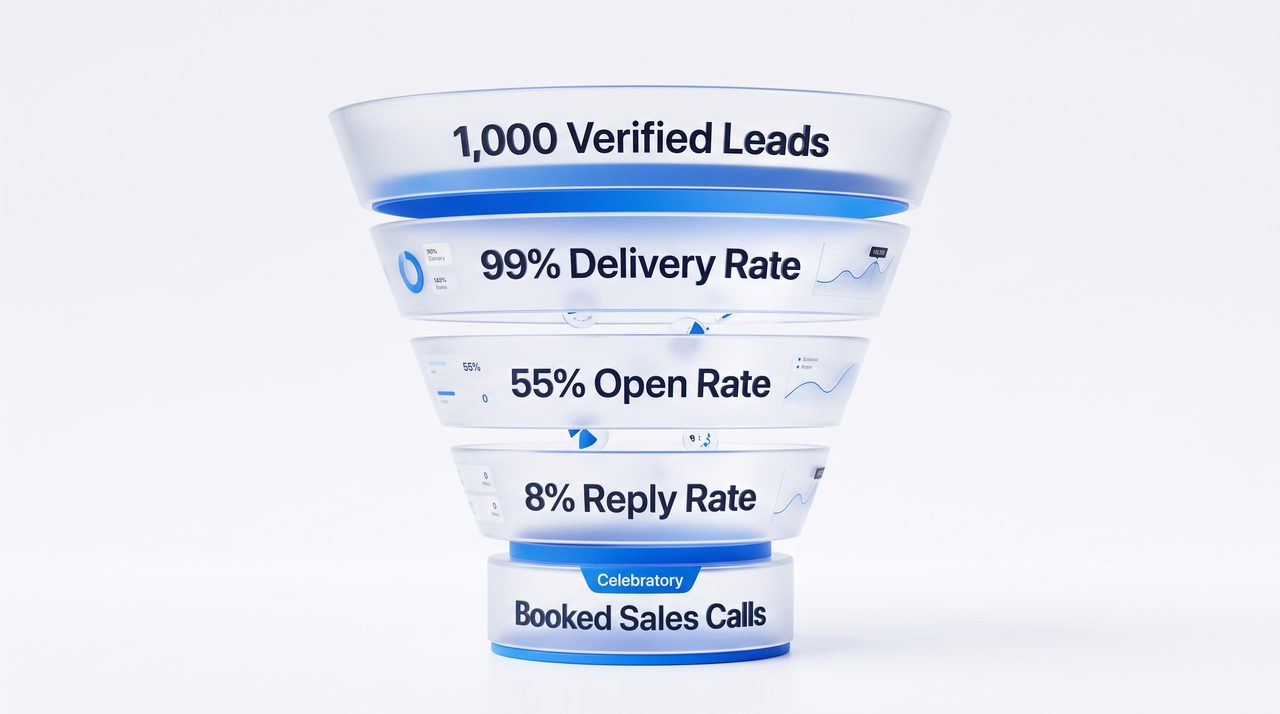
Industry benchmarks vary depending on list quality, total volume, and deliverability infrastructure. Below are the performance tiers for targeted B2B outbound campaigns:
| Metric | Underperforming | Industry Average | Top Tier (Optimized) |
|---|---|---|---|
| Delivery Rate | < 95% | 96% – 98% | 99%+ |
| Bounce Rate | > 4% | 2% – 3% | < 1.5% |
| Open Rate | < 30% | 40% – 55% | 60% – 75%+ |
| Overall Reply Rate | < 3% | 4% – 7% | 8% – 15%+ |
| Positive Reply Ratio | < 15% | 25% – 35% | 40% – 60%+ |
| Spam Complaint Rate | > 0.20% | 0.05% – 0.10% | < 0.03% |
2. Core Metrics Defined & What They Signal
Open Rate (40% – 60%+)
- What it measures: The percentage of successfully delivered emails opened by recipients.
- What it signals: Domain reputation, technical inbox placement (Primary Inbox vs. Spam/Promotions tabs), and subject line relevance.
- The Caveat: Tracking pixels can be obscured by Apple Mail Privacy Protection (MPP) and security gateways. Sending through authentic, native Google accounts typically yields open rates 15% to 25% higher than shared marketing IP pools.
Reply Rate (5% – 15%+)
- What it measures: The percentage of recipients who actively respond to your email.
- What it signals: The true North Star of cold outreach. High reply rates indicate strong ICP (Ideal Customer Profile) alignment, compelling problem-agitation copy, and low-friction calls to action.
Positive Response Ratio (30% – 50% of total replies)
- What it measures: The proportion of responses that express genuine interest, book a call, or request further information (excluding “Not interested” or “Unsubscribe” replies).
- What it signals: Product-market fit and offer strength. If reply volume is high but mostly consists of objections, the value proposition or targeting requires adjustment.
Bounce Rate (< 2%)
- What it measures: The percentage of sent emails rejected by receiving mail servers due to non-existent addresses or invalid domains.
- What it signals: List hygiene. Any bounce rate exceeding 3% puts your domain at immediate risk of throttling by major email providers.
3. Campaign Funnel Economics: 1,000 Verified Prospects
To understand how individual conversion rates compound across a campaign, consider this realistic projection based on an optimized B2B outbound workflow:
[1,000 Verified Contacts]
         │
         ▼ (99% Delivery)
  [990 Delivered]
         │
         ▼ (55% Open Rate)
   [544 Opens]
         │
         ▼ (8% Reply Rate)
   [79 Total Replies]
         │
         ▼ (45% Positive Ratio)
   [35 Qualified Leads]
         │
         ▼ (50% Meeting Conversion)
   [17 Booked Discovery Calls]
At an average deal size of $2,500 with a standard 20% sales close rate, this single batch of 1,000 contacts yields 3 to 4 closed customers ($7,500 – $10,000 in pipeline revenue).
4. Primary Drivers of Campaign Performance
1. Delivery Architecture (Native vs. Broadcast)
Emails sent through shared ESP servers (Mailchimp, Brevo) carry marketing header metadata (List-Unsubscribe, bulk routing tags) that automatically trigger Gmail’s Promotions tab. Direct, browser-native tools like SendGM route individual messages through your active Google Workspace session, maintaining primary 1-to-1 inbox placement.
2. Subject Line Psychology
Data shows that simple, unhyped subject lines consistently outperform marketing slogans:
- ❌ Sales Pitch: “Triple your engineering team’s output this quarter!” (Lower open rate, flagged by heuristic spam filters).
- ✅ Conversational: “quick question regarding {{Company}}” or “intro / {{First Name}}” (65%+ open rate, mimics organic internal correspondence).
3. CTA Friction Levels
The biggest drop-off between opens and replies happens at the Call to Action:
High Friction: "Can you block out 30 minutes on my calendar link below?" (1% - 3% Reply)
Low Friction:  "Open to checking out a 2-min breakdown, or not a fit right now?" (8% - 14% Reply)
5. Campaign Troubleshooting & Diagnostic Guide
If your outreach campaigns fall below target thresholds, use this checklist to isolate the bottleneck:
Problem: Low Open Rate (< 30%)
- Diagnosis: Deliverability failure or weak subject lines.
- Action Steps:
- Verify SPF, DKIM, and DMARC records using an MX lookup tool.
- Lower daily sending volume per inbox to under 50 emails/day.
- Shorten subject lines to 2–4 lowercase words without exclamation marks or trigger words (“free”, “guarantee”, “deal”).
Problem: High Open Rate (> 50%) but Low Reply Rate (< 3%)
- Diagnosis: Weak offer, irrelevant list targeting, or high CTA friction.
- Action Steps:
- Cut email body length down to under 100 words.
- Remove calendar links (
calendly.com) and generic PDF attachments from the first email. - Replace the meeting request with an interest-based question (“Worth a quick look?”).
Problem: High Bounce Rate (> 3%)
- Diagnosis: Stale or scraped contact data.
- Action Steps:
- Run your CSV list through a contact hygiene verification tool before sending.
- Remove all “catch-all” (accept-all) domains that cannot be verified with certainty.
Frequently Asked Questions
How many follow-ups should I send to maximize reply rates?
A sequence of 3 to 4 total emails spaced across 10 to 14 days delivers optimal results. The first email generates roughly 40%–50% of total replies, while follow-ups account for the remaining 50%–60%. Sending beyond 5 touches yields diminishing returns and increases spam complaint risk.
Are tracking pixels harmful to deliverability?
Open tracking requires embedding a 1x1 transparent image in the email body. While generally accepted, aggressive spam filters occasionally flag tracking pixels in cold messages. For hyper-targeted outreach (e.g., enterprise pitching), turning off open tracking and focusing solely on reply volume maximizes primary inbox placement.
What is the maximum number of cold emails one Google account can send daily?
While Google Workspace allows up to 2,000 total daily emails for standard transactional communication, outbound cold outreach should remain capped at 40 to 50 emails per day per account. To scale outbound volume safely, distribute sending across multiple domains and dedicated accounts.